|
|
First, we invoke kcrash on a dump image :
# kcrash crash.mmdd sym.mmdd S> rg panicregs S> < /crash/macros/loadmacs
To start at the beginning, we want to run the streams macro. Since the output of the streams macro will give pages and pages of data, we want to save the output for examination later using an external editor. To open an output file that will contain all the keystrokes and output of kcrash commands, we use the 'of' (open file) command in kcrash. We can give the file any name. Usually, I use a filename that is the same as the macro that I am running as this is an easy reference for me. You may use any naming convention.
S> of streams
Now that the file is open, we execute the streams macro:
  S> streams
  stream D158FC80  iocwwait 0000  rerr 00000000   werr 00000000  pushcnt 00000001
  flag   00000040: STPLEX
  sigflg 00000000:
  evflag 00000000:     pollevents 0000:
  sd_vnode     D158F804:
  dev             51/00:
  sd_sidp      00000000:
  sd_pgidp     00000000:
  sd_eventlist 00000000:

  queues D158FD00, D158FD4C
  Downstream from queue D158FD4C:
  queue    bsrv     idname   ptr   count cpu plumbing:sched:flag
  D158FD4C D158E54C strc     D158FC80 12411 UBND PROCSON WANTW FULL USE
      msgb     type       rf size    psize    next
      D1A69A20 01 PROTO   01 00000100 0000003C D1649FA0
      D170C9C0 00 DATA    01 00000100 00000028 00000000
      D15224C0 00 DATA    02 00000100 00000001 00000000
...
      D1D82FE0 00 DATA    02 00000100 00000001 00000000
      D1D82FE0 00 DATA    02 00000100 00000001 00000000

  D158E64C D158FD4C app      D01EE3BC 00 UBND PROCSON WANTR USE
  D158FA4C D158FD4C strm     00000000 32808 0000 PROCSON WANTW FULL USE
      msgb     type       rf size    psize    next
      D1477860 01 PROTO   01 00000100 0000001C D1795940
      D17A96C0 00 DATA    01 00000100 00000028 00000000
...
      D174C6A0 00 DATA    01 00000400 000005B4 00000000
      D174C6A0 00 DATA    01 00000400 000005B4 00000000

  Upstream from queue D158FB00:
  queue    bsrv     idname   ptr   count cpu plumbing:sched:flag
  D158FB00 00000000 ethernet D15094EC 00 0000 PROCSON WANTR READR USE
  D158FA00 D158FB00 strm     00000000 00 UBND PROCSON WANTR READR USE
  D158E600 D158FA00 app      D01EE3BC 00 UBND PROCSON WANTR READR USE
  D158FD00 D158FA00 strc     D158FC80 00 UBND PROCSON WANTR READR USE
  D158E500 D158FA00 ip       D021A28C 00 UBND PROCSON MUXLOW WANTR READR USE
...
  S>  cf
The 'cf' command of kcrash is used to close the output file. The output given above is just a sample of one portion of one stream but shows all the fields generated by the streams macro.
Much of the data shown by the streams macro is very useful. We can see that the 'stream' field has an address which is the address of a stream.
To make understanding all the fields easier, here they are explained in order
of appearance:
  stream          D158FC80          /* address of a stream */
  iocwwait        0000              /* sd_flag see sd.h */
  rerr            00000000          /* number of read errors */
  werr            00000000          /* number of write errors */
  pushcnt         00000001          /* number of pushes done on this stream */
  flag            00000040: STPLEX  /* type of stream see strsubr.h */
  sigflg          00000000          /* from stdata struct see sd_sigflags */
  evflag          00000000          /* event flag see events.h */
  pollevents      0000              /* number of events being polled */
  sd_vnode        D158F804          /* pointer to associated vnode */
  dev             51/00:            /* maj/min number of device */
  sd_sidp         00000000:         /* pointer to pid controlling session info */
  sd_pgidp        00000000:         /* pointer to pid-controlling group info */
  sd_eventlist    00000000:         /* pointer to strevent-rcv general events */
  queue           D158FD4C          /* queue pointer */
  bsrv            D158E54C          /* queue pointer for backenable */
  idname          strc              /* module name */
  ptr             D158FC80          /* pointer to queue private data struct */
  count           12411             /* number of bytes on queue */
  cpu             UBND              /* cpu number if bound to CPU */
  plumbing        PROCSON           /* plumbing flags for queue */
  sched           WANTW             /* flag for servicing scheduling */
  flag            FULL USE          /* queue flow control flags */
  msgb            D1A69A20          /* pointer to message block */
  type            01 PROTO          /* message type */
  rf              01                /* count of messages using this data block */
  size            00000100          /* total allocated size of data block */
  psize           00000003          /* actual number of bytes of data in block */
  next            D1649FA0          /* address of next PROTO */
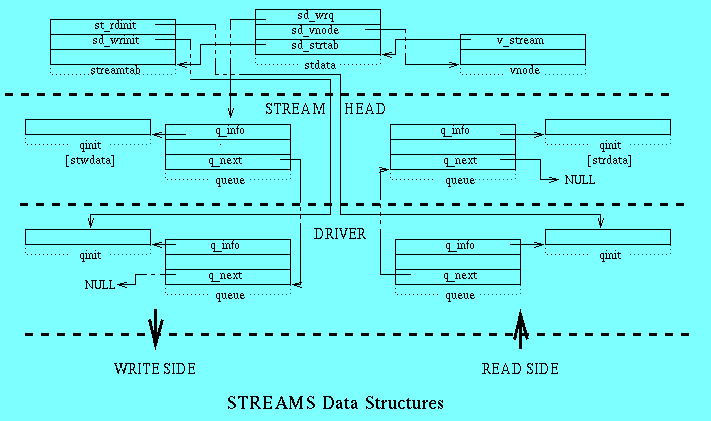
Next, let us look at what is considered the header for a stream, the stdata
structure. After saving the output from the streams macro to a file, use the
stdata macro and give it the address of a stream as an argument.
  S> stdata D158FC80
  sd_wrq          D158FD4C      /* write queue */
  sd_iocblk       00000000      /* pointer to return block for ioctl */
  sd_vnode        D158F804      /* pointer to the associated vnode */
  sd_strtab       D1508C94      /* pointer to the streamtab structure */
  sd_flag         00000040      /* state/flags */
  sd_iocid        000000E7      /* ioctl id */
  sd_iocwait      00000000      /* count of procs waiting to do ioctl */
  sd_sidp         00000000      /* pointer to controlling session info */
  sd_pgidp        00000000      /* pointer to controlling process group info */
  sd_wroff        00000000      /* write offset */
  sd_rerror       00000000      /* read error to set u.u_error */
  sd_werror       00000000      /* write error to set u.u_error */
  sd_pushcnt      00000001      /* number of pushes done on stream */
  sd_sigflags     00000000      /* logical OR of all siglist events */
  sd_siglist      00000000      /* pid linked list to rcv SIGPOLL sig */
  sd_eventflags   00000000      /* logical OR of all eventlist events */
  sd_eventlist    00000000      /* linked list to rcv general events */
  sd_pollist      D158FCC4      /* list of all pollers to wake up */
  sd_mark         00000000      /* "marked" message on read queue */
  sd_closetime    000005DC      /* time to wait to drain q in close */
  sd_rtime        00000000      /* time to release held message */
  sd_stream_lckp  D158E300      /* MP lock pointer for q_next, q_plumbing, q_ref */
The first field sd_wrq is a pointer to the stream head (a write queue) on the associated stream. This pointer can be used to look at the queue structure which we will discuss later in this section. If the sd_iocblk field contains an address, it is the address of a msgb structure. The sd_vnode field contains a pointer to the associated vnode.
If sd_vnode in non null and dev is equal to 83/00, then the stream is a pipe. This can be verified using the 'vnode' macro. First, find a stream with device 83/00:
  S> stream D169F580
  stream D169F580  iocwwait 0000  rerr 00000000   werr 00000000  pushcnt 00000000
  flag   00010000: OLDNDELAY
  sigflg 00000000:
  evflag 00000000:     pollevents 0000:
  sd_vnode     D169FA00:
  dev             83/00:
...
then, using the pointer given in sd_vnode, run vnode:
  S> vnode D169FA00
[D169FA00]  type 6: VFIFO  flag 0000:
count   00001.  vfsmnt 00000000   ops D01AC6B0  stream D169F580  locks 00000000
 rdev 014C0000    vfsp D1289280  data D169FA00   pages 00000000
The type of vnode is 6 or VFIFO which shows that it is a pipe.
It is also possible that a stream is a socket in which case, the idname would
be "sockmod". Please obtain the ipc.k file from Appendix C2 before running
this macro. To see all the sockets on the system, use the sockets macro:
The two fields are the number of the socket and a pointer to the "so_so"
structure which is defined in sockmod.h. Then, using a new macro called
so_so, it would be possible to view this structure. Here is the macro to use: S> sockets
000 D0266B44
001 D0266C44
002 D0266D44
003 D0266E44
004 D0266F44
...
02A D0269544
02B D0269644
02C D0269744
02D D0269844
  S> so_so D0269044
  flags         00000001      /* internal flags: see timod.h */
  *rdq          D18E0B00      /* pointer to the read queue of the socket */
  *iocsave      00000000      /* pointer to mblk_t structure */
  tp_info      @D0269050      /* t_info information */
  raddr        @D026906C      /* netbuf information */
  laddr        @D0269078      /* netbuf information */
  lux_dev      @D0269084      /* ux_extaddr information */
  rux_dev      @D0269090      /* ux_extaddr information */
  so_error      00000000      /* error affecting connection (socketvar.h) */
  *oob          00000000      /* pointer to message block containing out-of
                                 band bytes*/
  *so_conn      00000000      /* pointer to so_so */
  *so_peerso    00000000      /* pointer to so_so */
  *consave      00000000      /* pointer to msgb */
  udata        @D02690B0      /* si_udata information */
  so_option     00000000      /* socket options */
  *bigmsg       00000000      /* pointer to msgb */
  so_ux        @D02690D4      /* so_ux information */
  hasoutofband  00000000      /* socket option so_oobline */
  *urg_msg      00000000      /* pointer to any priority message(s) */
  sndbuf        00000000      /* send buffer size */
  rcvbuf        00000000      /* receive buffer size */
  sndlowat      00000000      /* send lo-water mark */
  rcvlowat      00000000      /* receive lo-water mark */
  linger        00000000      /* linger on close */
  sndtimeo      00000000      /* send time out */
  rcvtimeo      00000000      /* receive time out */
  prototype     00000000      /* send prototype */
  esbcnt        00000000      /* count of datab allocated from private pool */
  so_used       00000001      /* the socket that is being used */
  so_freeref    00000000      /* used internally for locking */
  so_lck       @D0269110      /* the mutex lock */
  so_bid        00000000      /* flag for bufcall action */
  so_rdcnt      000006BB      /* read count */
  so_wrcnt      00022C48      /* write count */
The so_so structure mainly contains socket options like SO_LINGER (linger). I
would suggest referencing your favorite network programming book or see Appendix
D2 for our list of references.
Now let's get back to the streams structure. Using the sd_strtab field, run streamtab to examine the streamtab structure:
Figure 3 (struct streamtab)
  S> streamtab D1508C94
  st_rdinit    D1508C78      /* read queue initialization */
  st_wrinit    D1508C5C      /* write queue initialization */
  st_muxrinit  00000000      /* mux read queue initialization */
  st_muxwinit  00000000      /* mux write queue initialization */
all entries are pointers to the qinit structure and can be given as arguments
to the qinit macro.
For example, to look at the qinit structure of the read queue associated with this stream, one would use:
Figure 4 (struct qinit)
  S> qinit D1508C78
  qi_putp()    00000000      /* put procedure */
  qi_srvp()    D15057E0      /* service procedure */
  qi_qopen()   D1504D00      /* called on startup */
  qi_qclose()  D1505680      /* called on finish */
  qi_qadmin()  00000000      /* for future use */
  qi_minfo     D1508C44      /* module information structure */
  qi_mstat     00000000      /* module_stat structure */
Then, it is possible to view the module_info structure using the moduleinfo
macro and the qi_minfo address above:
Figure 5 (struct module_info)
  S> moduleinfo D1508C44
  mi_idnum    00000835                /* module id number */
  mi_idname   D150901C   ethernet     /* module name */
  mi_minpsz   00000000                /* min packet size accepted */
  mi_maxpsz   000005DC                /* max packet size accepted */
  mi_hiwat    00008000                /* hi-water mark */
  mi_lowat    00002000                /* lo-water mark */
mi_minpsz and mi_maxpz are the default minimum and maximum packet sizes that are
accepted (in bytes). The mi_hiwat and mi_lowat fields are the hi and low water
marks that are used by the flow control mechanism. The flow control and packet
size information is also held in the queue structure, but module_info holds the
default values for each module type. The values are given in bytes. When the
queue was initialized, it used these values. If subsequent ioctl calls modify
any of these, the changes will only be noted in the queue structure, not the
module_info structure.
The mi_idname is the type of module that was pushed on the stream. This could be strrhead, strwhead, ttcompat, ldterm, sockmod, etc.
The module_stat structure Figure 6 (struct module_stat) may or may not contain an address. This field will contain a pointer to the structure only if the procedure updates it. Some applications do update this structure, but I was unable to find such an example. If you do have a pointer, load module_stat.k. Macro 2 (module_stat.k)
The cdevsw and fmodsw macros can be used to view all the character device switch tables and the module switch tables. They both contain pointers to the streamtab structure which are d_str and f_str respectively. Every module and driver on the system must be identified by either cdevsw[] or fmodsw[]. Please obtain a copy of device.k from Appendix C2 before using cdevsw or fmodsw.
To view all of the entries in the fmodsw table, use:
  S> fmodsw+ fmodsw
  f_name  ldterm          /* name of module */
  f_str   D019D688        /* pointer to streamtab struct */
  f_flag  D019D698        /* same as device flag */
  f_cpu   000C0000        /* MP cpu binding */
  S> nx
...
There is also the block device switch table. A device is usually either
a character device or a block device. If a device is both, then it will
have an entry in both the cdevsw table and the bdevsw table. If you did not
obtain a copy of the device.k macro prior to this, please load it before
running bdevsw. To view the bdevsw table, use:
  S> bdevsw+ bdevsw
  d_open     D00D48F0(ucsdopen)      /* function called to open device */
  d_close    D00D4DF0(ucsdclose)     /* function called to close device */
  d_strategy D00D6250(ucsdstrategy)  /* read/write request entry point */
  d_print    D00D6550(ucsdprint)
  d_size     D00D5120(ucsdsize)      /* size of disk partition */
  d_xpoll    D0047B30(nodev)         /* used to poll for events */
  d_xhalt    D0047B30(nodev)         /* used to shut down device */
  d_name     ucsdisk                 /* name of device */
  d_tab      00000000                /* pointer to iobuf structure */
  d_flag     00000110                /* driver status flags */
  d_cpu      FFFFFFFF                /* MP cpu binding */
  S> nx
...
Now, back to the stdata structure. The sd_flag field defines the states or flags for the stream. In this case 0x40 which indicates that the stream is multiplexed. (see the /usr/include/sys/strsubr.h file for an explanation of all the flags).
The sd_siglist and sd_eventlist fields both contain pointers to the strevent structure. The strevent structure is a union of several other structures including the 'proc' structure. Although it is not obvious whether or not these pointers are pointing to a 'proc' structure, it is possible that they are. If one or both were pointing to a proc structure, you would know which processes were to be sent a SIGSEL signal or were sleeping on select(). (See /usr/include/sys/stropts.h and /usr/include/sys/select.h for valid SIGSEL and signal() events respectively.)
Figure 7 (struct strevent)
In this example, we are using an address of a different stream than shown in the
output from stdata above.
  S>stdata D149B700
...
  sd_sigflags     00000001
  sd_siglist      D149B580
  sd_eventflags   00000000
  sd_eventlist    00000000
...
  S> dy D149B580
  D149B580:  D1195A00 00000001 00000000 00000000  .Z.............. .
/* note that to end the 'dy' kcrash command, you enter a '.' */
  S> proc D1195A00
  [D1195A00]   SLEEP (E0004000)  flag 1102010: LOAD ULOAD EXECED JCTL
   pid 02802.   pri 41   sig 00000000  ign 611C0000  kbd -  ubd -    uid 00000.
  ppid 02735.  csig 00  mask 00000000  cid 00000002  run -          usiz 0002
  pgrp 02735.  cflt 00  hold 00000000   as D1476580  mutx D1195B8C  segu F0BD0000
  p_exec D121B3B0 p_cred D1143B80 p_ubptbl C0462F40
  u.u_psargs = "/usr/lib/saf/ttymon "
The only reason we know that the address is that of a process, is due to the fact
that the 'proc' macro printed out valid information as can be seen by the 'u.u_psargs'
value. One could also check the validity of the address by running the 'ps' kcrash
macro, and searching for the address. This is obviously rather cumbersome way of finding
this information, but is shown here as a point of interest.
There are many more fields of interest in the stdata structure. Using a macro generator, it would be possible to view other structures, like 'pid' using values given in other fields of the stdata output. See the file /usr/include/sys/strsubr.h for more information.
There is a structure which keeps track of resources that have been allocated for streams. It is the strinfo structure which is an array. There is one entry in the array for each streams resource. This structure is used by the crash dump facility to dump the data structures. The best view we get of the strinfo structure is through the linkblk macro of kcrash. (linkblk is also a structure).
  S>linkblk
  LINKBLK TABLE SIZE = 22
  LBLKADDR      QTOP      QBOT  FILEADDR  MUXID
  D159C680  00000000  D158F64C  D139235C    022
  D159CC80  00000000  D158F74C  D1392404    021
  D158FC40  00000000  D158E54C  D1391498    020
  D158EA00  00000000  D155DF4C  D1392458    019
  D155D840  00000000  D155CE4C  D1392944    018
  D155C580  00000000  D157154C  D13927F4    017
  D1571840  00000000  D157164C  D13928F0    016
  D14A4B80  00000000  D14A4A4C  D1393370    015
  D14A34C0  00000000  D14A354C  D13933C4    014
  D14A3DC0  00000000  D14A3E4C  D1393418    013
  D1498D00  00000000  D14A684C  D139346C    012
  D14A2700  00000000  D14A234C  D13934C0    011
  D14A2D40  00000000  D14A2C4C  D1393514    010
  D149D900  00000000  D149D74C  D1393568    009
  D149C2C0  00000000  D149C34C  D13935BC    008
  D149CBC0  00000000  D149CC4C  D1393610    007
  D149BA00  00000000  D149B64C  D1393664    006
  D149A500  00000000  D149BF4C  D13936B8    005
  D149AE00  00000000  D149AA4C  D139370C    004
  D1499640  00000000  D149954C  D1393760    003
  D1498340  00000000  D149824C  D13937B4    002
  D1497C80  00000000  D149794C  D1393808    001
In this case, 22 strinfo structures have been allocated. The LBLKADDR field is a pointer to the linkblk structure. QTOP is a pointer to the lowest level write queue of the upper stream, but is always NULL. QBOT is a pointer to the highest level write queue of the lower stream. In our implementation, it is the same as the 'bsrv' field of streams so it is a pointer to the back service queue for backenable. The FILEADDR field contains a file pointer for the lower stream. It is actually obtained from the linkinfo structure (see /usr/include/sys/strsubr.h). The MUXID is a unique id for each connection which is used for routing and is the return value of the I_LINK ioctl.
Before moving on to a discussion of queue structures, there are other macros
that are available which show streams related information. Probably the most
widely used and certainly one of the most useful of these other macros is the
strstat macro.
The strstat macro shows the system streams statistics. It is very useful
in determining whether the system is running out of any stream related
resources.
  S> strstat
  [D0241370] [D0264830]
            inuse   (Strinfo)  total    max      fail
  stream    000000AF(000000AF) 000004B8 000000CB 00000000
  queue     00000494(00000494) 00001618 0000054C 00000000
  msgblock  00003739(000040EE) 0197AC88 000040EE 00000000
  mdbblock  0000359F(00003A83) 0162F9FB 00003A79 00000007
  linkblk   00000016(00000016) 00000016 00000016 00000000
  strevent  00000008(00000008) 00000008 00000008 00000000
  Total byte count = 00459BBF
  strthresh = 00000000
The in use column shows the number of resources in use, the Strinfo column gives the amount of allocated resources, the total is a cumulative total of used resources, and max represents the maximum item usage count. For example the greatest number of streams that were in use at any given time was 203.
The fail column is used to count the number of times a resource failed to be allocated. Any failures should be noted and further analysis is then warranted. In this case, we see that there are 7 failures in mdbblock. We would then run something like kmeminfo as these are an indication of kernel memory failures.
So, there are 175 streams in use, 1172 queues in use, 14137 message blocks, etc.
The total byte count shows the amount of memory currently in use by streams and strthresh is the amount of memory that has been allocated for use by streams. If strthresh is 0 (zero), then all of system memory can be consumed by streams. The strthresh value represents the kernel parameter STRTHRESH. The strstat macro is an easy way to verify the size of the STRTHRESH tunable.
If the stream is multiplexed, then there will be no streams owner and strowner will return nothing. i.e. if "flag" is equal to 40 (STPLEX) then strowner will return nothing.
  S> stream D158FC80
  stream D158FC80  iocwwait 0000  rerr 00000000   werr 00000000  pushcnt 00000001
  flag   00000040: STPLEX
...
Now, let us move on to the queue structures. There are several structures involved: queue, qinit and qband. Using information from these structures will lead us into the following section which discusses messages. We have discussed the qinit structure previously. If you wish to review that section, click here : Review qinit
Queues
Using the queues macro, it is possible to display all of the queues along
with all of the messages associated with them. Since this macro can
potentially generate pages and pages of data, it is wise to save the information
to a file. Again, I chose to make the name of the file match the name of
the macro.
  S>of queues
  S>queues
  queue    bsrv     idname   ptr   count cpu plumbing:sched:flag
  D1930300 D1A58F00 pckt     00000000 00 UBND PROCSON WANTR READR USE
  D193034C D1AEF84C pckt     00000000 00 UBND PROCSON WANTR USE
...
  S>cf
Now that we have all the queues saved, we can use a macro called 'queue' to examine them individually. Macro 3 (queue.k)
Using this macro and either the address given in the stdata structure 'sd_wrq' above or by using the address of a queue from the saved queues file, we can examine the queue structure. In this case, I used the sd_wrq pointer value from stdata.
If you choose to use the information from queues, make sure to give 'queue' the address of a queue which contains data. A queue with data would look something like this:
  S> queues
  queue    bsrv     idname   ptr   count cpu plumbing:sched:flag
...
  D158FD4C D158E54C strc     D158FC80 12411 UBND PROCSON WANTW FULL USE
      msgb     type       rf size    psize    next
      D1A69A20 01 PROTO   01 00000100 0000003C D1649FA0

      D170C9C0 00 DATA    01 00000100 00000028 00000000
...
Figure 9 (struct queue)
  S> queue D158FD4C
  *q_qinfo    D01A5840      /* ptr to the qinit struct */
  *q_first    D1A69A20      /* ptr to msgb - 1st data block */
  *q_last     D1D82FC0      /* ptr to msgb - last data block */
  *q_next     D158E64C      /* ptr to next queue in stream */
  *q_link     00000000      /* ptr to next queue for scheduling */
  *q_ptr      D158FC80      /* ptr to private data struct */
  q_count     0000307B      /* number of bytes on queue */
  q_flag      00000020      /* queue state */
  q_minpsz    00000000      /* min packet size */
  q_maxpsz    00008000      /* max packet size */
  q_hiwat     00003000      /* hi water mark */
  q_lowat     00000040      /* lo water mark */
  *q_bandp    00000000      /* ptr to qband struct */
  q_nband     00            /* number of priority bands */
  q_sched     01            /* flag for srv scheduling */
  q_plumbing  01            /* plumbing flags for this queue */
  q_fflag     0000000C      /* queue flow control flags */
  q_cpu       FFFFFFFF      /* MP cpu binding */
  *q_strhead  D158FC80      /* pointer to stream head */
  *q_bsrv     D158E54C      /* back service queue for backenable */
  q_lock      00000000      /* protects q_first,q_last & q_flags */
We have already discussed the qinit structure and the msgb structure is
discussed later. The only time that there will be a pointer to a qband struct
is if q_nband is greater than 0.
If you were to view a qband structure, this is the macro that you would use. Macro 4 (qband.k) The qband structure can be viewed: Figure 10 (struct qband)
QB_FULL         0x01       /* band is considered full */
QB_WANTW        0x02       /* Someone wants to write to band */
QB_BACK         0x04       /* queue has been back-enabled */
As with streams, there are other queue related macros, which are discussed
below.
Another way to view all the queues that have data is to use the cqueue macro
which requires no arguments.
  S> cqueue
  queue    bsrv     idname   ptr   count cpu plumbing:sched:flag
  D158754C D1AEDE4C tcp      D1942300 189 UBND PROCSON WANTR USE
  D1AA3C4C D17F944C tcp      D1A63480 1204 UBND PROCSON WANTR USE
  D191244C D1932A4C tcp      D1A43E00 1538 UBND PROCSON WANTR USE
  D174264C D166EF4C tcp      D1A4FF80 2021 UBND PROCSON WANTR USE
  D16F9E4C D1A87D4C tcp      D17AA400 2220 UBND PROCSON WANTR USE
  D159A54C D1ADA54C tcp      D1AED780 4719 UBND PROCSON WANTR USE
  D180134C D14D3E4C tcp      D1A76B80 4142 UBND PROCSON WANTR USE
  D1AC474C D17E7B4C tcp      D178A500 96 UBND PROCSON WANTR USE
  D18E034C D170974C tcp      D1848880 1139 UBND PROCSON WANTR USE
  D16E524C D1A9FD4C tcp      D1864C00 3114 UBND PROCSON WANTR USE
  D1AEAD4C D17B2F4C tcp      D1ADC780 1270 UBND PROCSON WANTR USE
  D1AC044C D1AA6F4C tcp      D14A5F00 7240 UBND PROCSON WANTR USE
  D158FA4C D158FD4C strm     00000000 32808 0000 PROCSON WANTW FULL USE
  D158FB4C D158FA4C ethernet D15094EC 32903 0000 PROCSON WANTW FULL USE
  D158FD4C D158E54C strc     D158FC80 12411 UBND PROCSON WANTW FULL USE
  1172. queues, Strinfo.cnt = 1172.
All the fields were defined when we discussed the queue structure except
idname. This field is actually the name of the module that has been pushed
on the stream. It was found by the cqueue macro in the module_info structure
which was also discussed previously.
The easiest way to see a summary of queues information is to use the
queues_flag macro.
  S> queues_flag
  queue    bsrv     idname   ptr   count cpu plumbing:sched:flag
  1172. queues, Strinfo.cnt = 1172.
This shows that there were 1172 queues and 1172 strinfo structures used.
Now we are ready to look at messages.
Messages:
In order to look at the msgb structure, we again need to generate our own
macro: Macro 5 (msgb.k)
Then, using either the q_first or q_last address given above (by the queue output), we can review the structure:
 S> msgb D1A69A20

  *b_next     D1649FA0       /* pointer to next message on queue */
  *b_prev     00000000       /* pointer to previous message */
  *b_cont     D170C9C0       /* pointer to next block of message */
  *b_rptr     D1A02424       /* pointer to read byte in buffer */
  *b_wptr     D1A02460       /* pointer to write byte in buffer */
  *b_datap    D1A02400       /* pointer to the data block */
  b_band      00             /* type db_band - priority band */
  b_pad1      00             /* filler */
  b_flag      0000           /* type db_flag - data block flag see buf.h */
  b_pad2      20202020       /* filler */
The fields b_next, b_prev and b_cont are all pointers to other msgb structures. b_rptr and b_wptr are the first unread and first unwritten byte in the buffer respectively. Using the b_datap pointer value, we can examine the datab structure after first generating a macro: Macro 6 (datab.k)
Figure 12 (struct datab)
  S> datab D1A02400
  db_f       @D1A02400       /* union of struct datab and struct free_rtn)
  *db_base    D1A02424       /* first byte of buffer */
  *db_lim     D1A02500       /* last byte plus one in buffer */
  db_ref      01             /* number of messages in this data block */
  db_type     01             /* type of message */
  db_iswhat   A0             /* not currently used */
  db_size     00000100       /* allocated size in bytes of the data buffer*/
  db_filler   00000000       /* reserved for future use */
  *db_msgadd  00000000       /* triplet mesg header that points to datab */
  db_cpuid    00000000       /* cpu binding for free_rtn */
  *db_frtna   00000000       /* linking wrapper for async free_rtn */
It is possible to see the actual contents of the buffer using the db_base address. Give this address as an argument to 'db' (display byte) or 'dl' (display long).
If db_type is 00, then the message is regular data otherwise, it is some type of control message. In this case, it is of type M_PROTO, a regular protocol control message.
The first table below describes regular control messages, the second defines
high priority messages. High priority messages always go to the head of the
queue and should never be placed back on the queue, they should be processed
immediately.
  M_PROTO         0x01       /* protocol control */
  M_BREAK         0x08       /* line break */
  M_PASSFP        0x09       /* pass file pointer */
  M_EVENT         0x0a       /* post an event to an event queue */
  M_SIG           0x0b       /* generate process signal */
  M_DELAY         0x0c       /* real-time xmit delay (1 param) */
  M_CTL           0x0d       /* device-specific control message */
  M_IOCTL         0x0e       /* ioctl; set/get params */
  M_SETOPTS       0x10       /* set various stream head options */
  M_RSE           0x11       /* reserved for RSE use only */
  M_VPIXINT       0x12       /* send pseudorupt to VP/ix process */

             Table 1 - Regular protocol control messages
Table 2 - High Priority control messages
As with queues and streams, there are other message related macros that are very useful.
The strmsg macro prints a streams message block information. This would be
an easy way to see all the messages associated with one stream. Give the
macro the address of a stream as an argument.
  S> strmsg D1A69A20
  msgb     type       rf size    psize    next
  D1A69A20 01 PROTO   01 00000100 0000003C D1649FA0
  D170C9C0 00 DATA    01 00000100 00000028 00000000
  D15224C0 00 DATA    02 00000100 00000001 00000000
  D15224C0 00 DATA    02 00000100 00000001 00000000
  D1649FA0 01 PROTO   01 00000100 0000003C D1AEBFE0
  D1A6D980 00 DATA    01 00000100 00000028 00000000
...
  D1D82FC0 01 PROTO   01 00000100 00000018 00000000
  D1D6B4E0 00 DATA    01 00000100 00000028 00000000
  D1D82FE0 00 DATA    02 00000100 00000001 00000000
  D1D82FE0 00 DATA    02 00000100 00000001 00000000
These fields were all defined in the Streams section when the streams structure was explained.
We have shown the stream, queue and message structures along with several macros for examining these structures. We have also explained in detail many other related macros. For more information on streams, please visit our bibliographic reference.